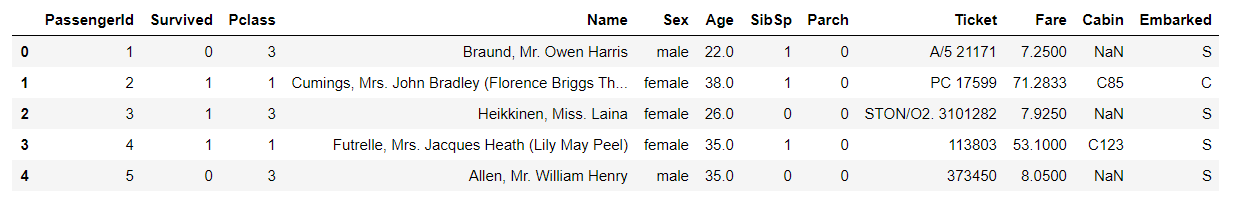
This is my first Kaggle’s machine learning (ML) competition. The idea of this competition is to predict the survival of Titanic passengers. So as a first step, I want to explore the data a bit.
Filling missing values
One great way to have an easy overview of missing data is to plot a heatmap where missing data is marked in white and the rest of it in black.
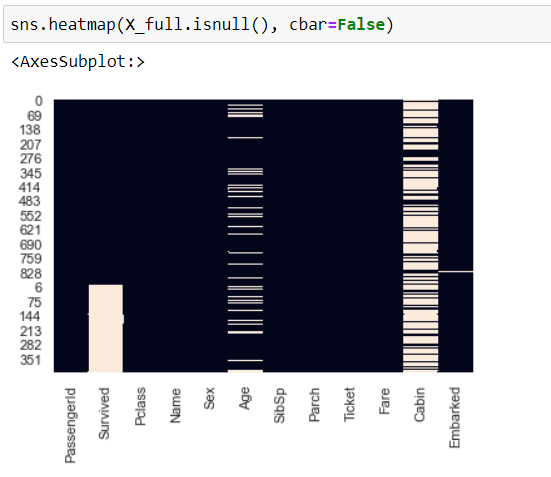
From this, it is obvious, that “age”, “cabin”, and “embarked” columns have missing values. The missing values have to be filled in or removed before moving to feature engineering. I have started with age and used several strategies to fill it in.
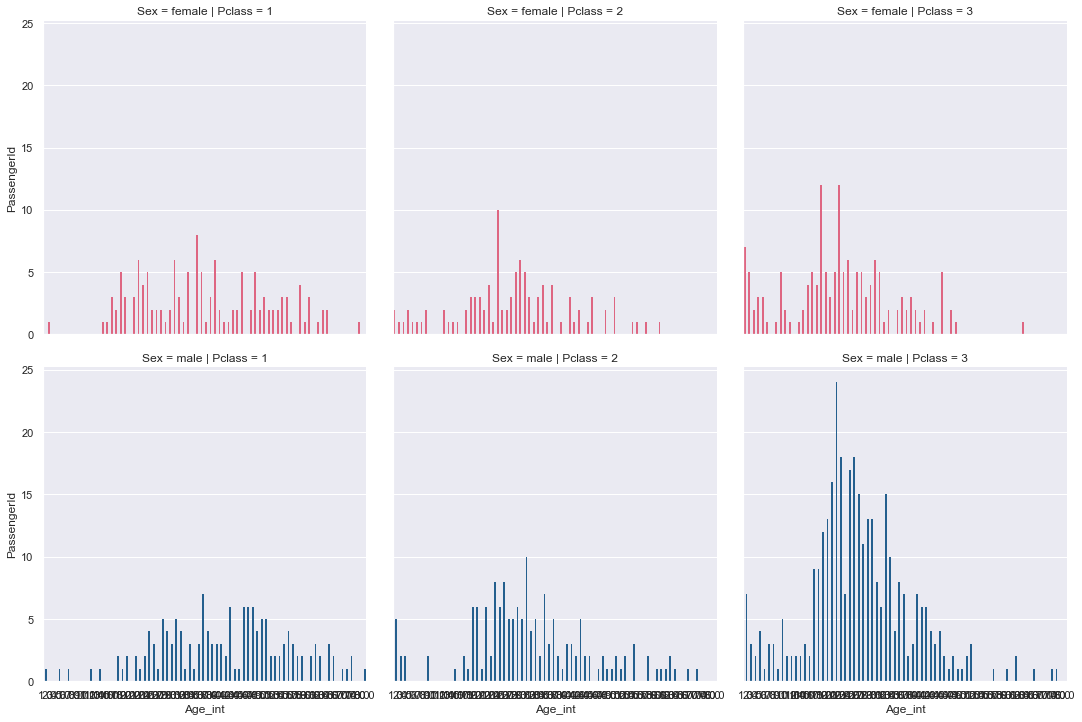
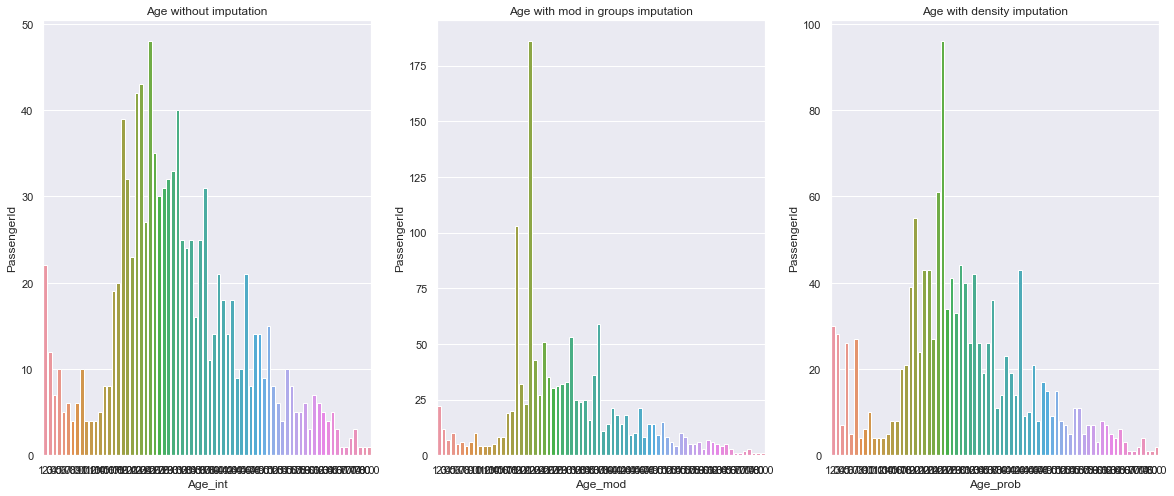
First, it has to be noted that there are different age distributions in “Class” and “Sex”. Hence first I marked those different “age” and “class” combinations as a “group”. Then I created two new columns for age which I filled for entries missing values. The first one is filled with the median age of the group. The second one is filled with a random value based on the frequency of ages in each group. After that, the data looks like in the pic below:
The second field with missing data is “Cabin”. In fact, the majority of it is missing. From the entries which are filled, it is clear that the value of the field “cabin” depends on the passengers’ class on the ship.
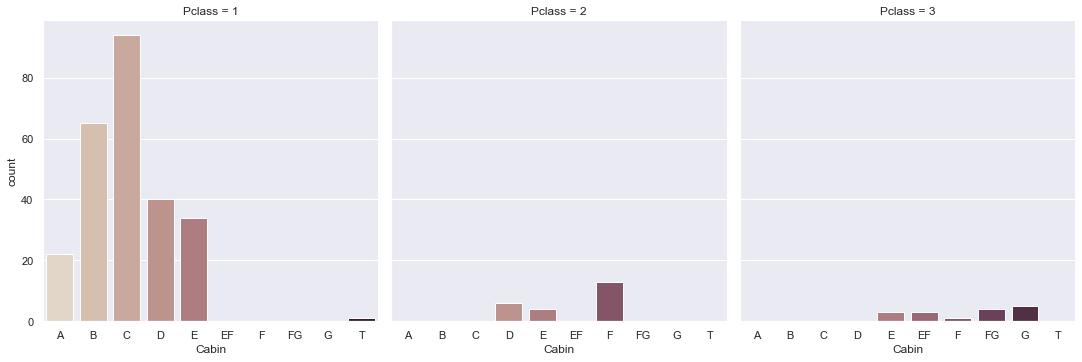
I decided to remove this column from the data. You can find how I filled the other columns with missing values in my Github profile link to notebook
Feature Engineering
It is interesting to see if there are some useful values from the Name column. Name and Surname are not valuable in the model building by themselves, but the title in the Name column is something that could be used. Most of the titles are Mr., Miss., Mrs. Some titles refer to the crew like Capt, Col, Major, and there are some royalty titles
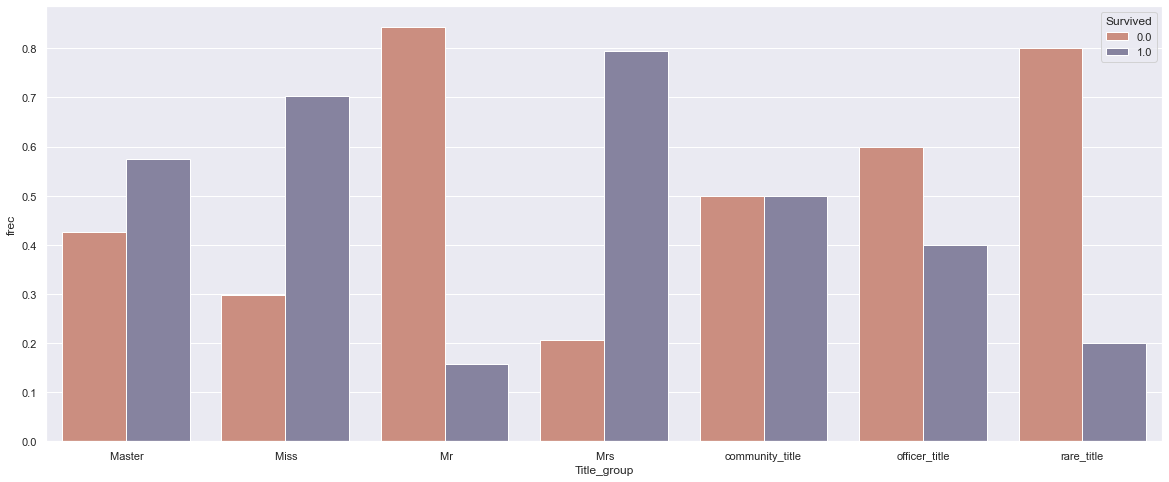
We already saw in the movie “Titanic” that the biggest chance to survive was if you were a woman. The graph above confirms the same.
Next interesting question is - who had a greater chance to survive the Titanic disaster: those who traveled alone or those who traveled as a part of a group?
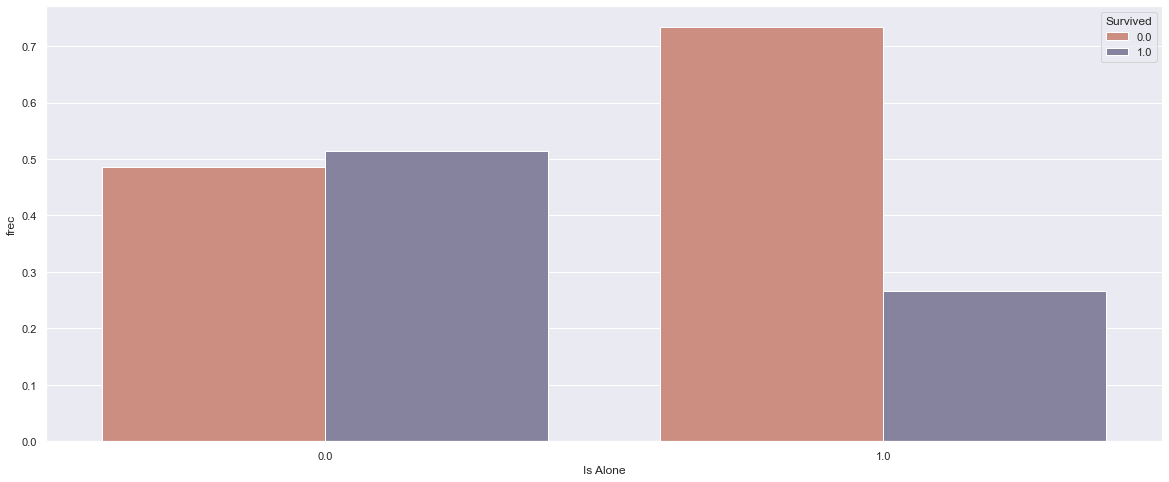
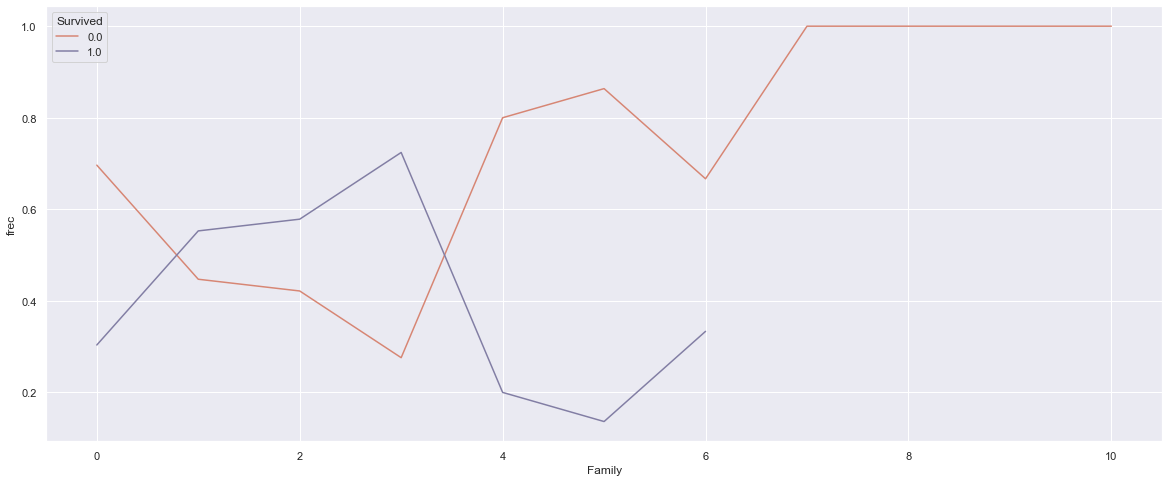
In the picture above we can see the mortality/survivability of those who traveled in a group (left) and those who traveled alone (right). Those who were alone on the ship had a lower probability to survive. (In each plot below in the text, 0 means “No” and 1 means “Yes”. For example, “Survived” with values 1 means passenger survived, and with value 0 means that passenger does not survive. ). Looking deeper, it is evident that families of 2-3 member had the highest chance of survival:
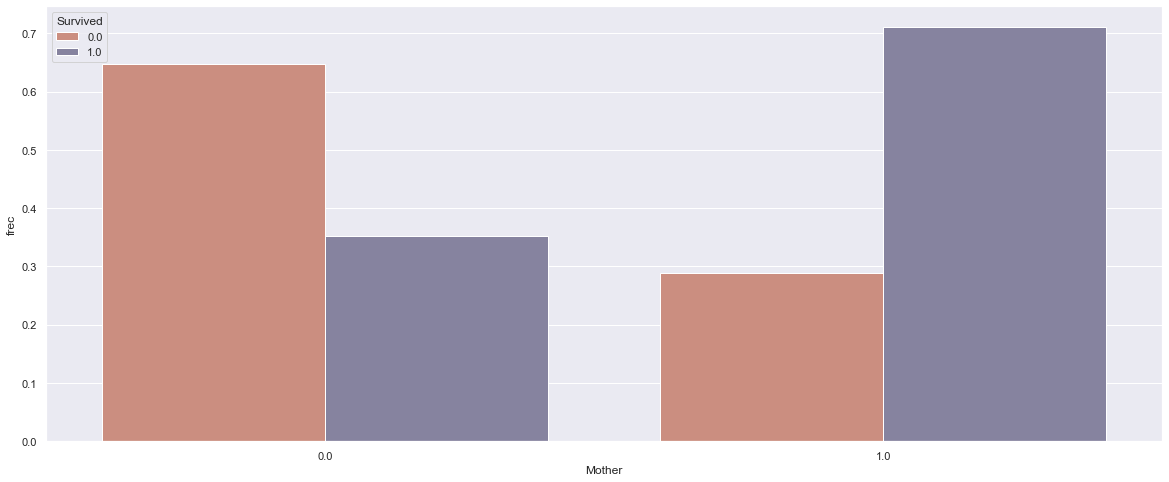
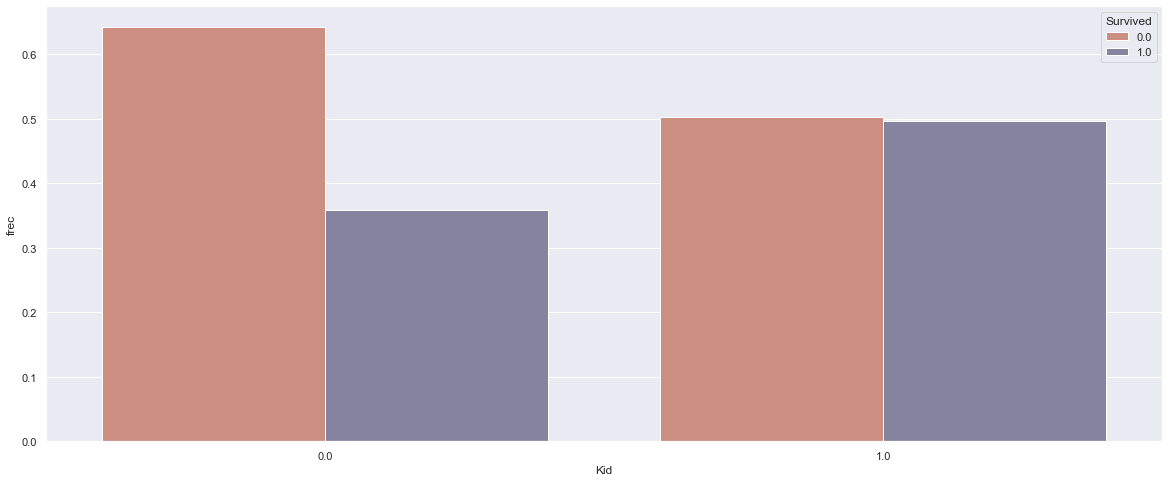
I also checked if being a mother or kid made an influence on surviving the Titanic disaster. And the plots below show that actually, it was important.
Modeling
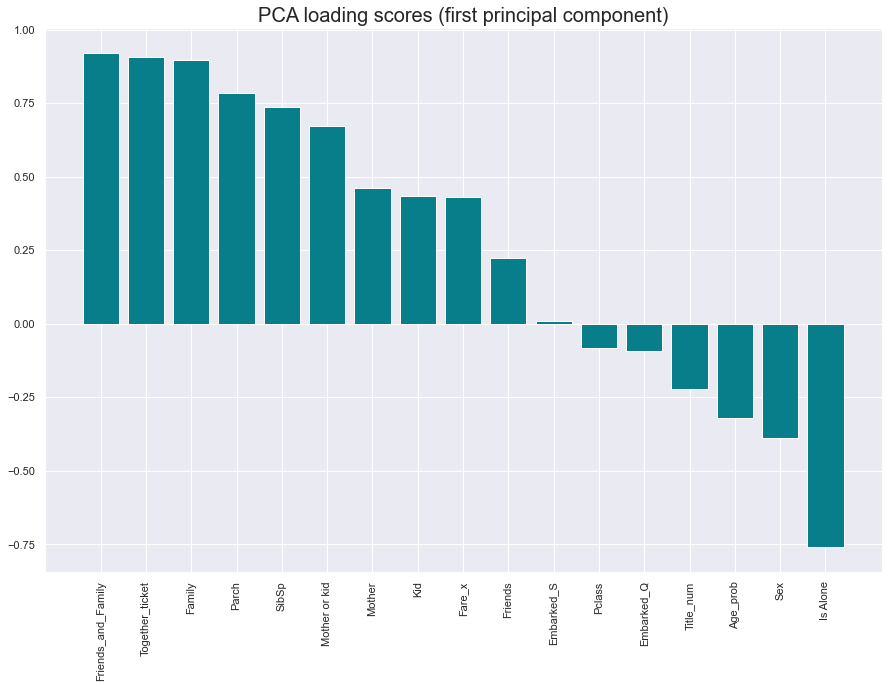
After cleaning and creating new features, I am ready to split data into training and testing. The next step after that is to scale data as some of the features are in the range [0-1] and some like age in [1-80]. I use StandardScaler from sklearn.preprocessing for that. At this point, I had 17 features and was not sure if all of them are needed. I have chosen to use principal component analysis (PCA). So I picked those features which with the first PCA component explains more than 30% of values.
Now, when I had my data ready, I started building the model. I tried k-nearest neighbor, logistic, decision trees, and random forest algorithms. I used GridSearchCV for hypertuning parameters. The results for each model were as listed:
knn 0.8268156424581006
log 0.8100558659217877
DTC 0.7988826815642458
RF 0.8212290502793296
Finally, I tried Voting Classifier with three of the models (I excluded the decision tree algorithm). It improved the score by 0.02 with an accuracy of 0.849 However, with unseen data, the model performs not so well. My score now is 0.75837 - this is still an improvement compared to my previous entry.
