Previously I wrote a few posts analyzing and cleaning Covid 19 data taken from the Lithuanian Open Data Portal. Now it’s time to predict some outcome. The data set contains records of people diagnosed with Covid-19. Features or columns in this data set are: outcome (in treatment, recovered, dead) - this is the one I will try to predict, age range, gender, district and three indicators (if a person had other illnesses; if a person was hospitalized; if a person was in intensive care).
Before building a model, I removed records where the outcome was error or NaN. I lost 0.76 % of the data. After exploring my dataset I noticed that additional NaN values were represented as blanks. So I changed it to NaN for easier further cleaning. Applying .isnull().sum() to my data set, I got that there were a few hundred more null values. I decided to remove those records too. In this case, I lost 0.6 % of my already cleaned data.
My data set contains just categorical data. Some values of the columns are Yes/No, other Female/Male. Age range column contains values like [0-9], [10-19]...[120-129] and district column contains names of the district. This data needs to be encoded to use it for machine learning. There are several ways to do that. For instance, to use pd.dummies() or OneHotEncoder(). However, I decided to convert object type to category and use .cat.codes. At this point, I am almost ready to build my machine learning algorithm to predict the outcome for the records with a status “in treatment”. Most of my data are encoded 0/1, but two columns, like age range and district, have way more options. It means those columns can have a heavier weight in a model. So with the line from sklearn.preprocessing import scale, I was able to use the scale() function to normalize my data. This is it. Now the fun part starts.
This is my first machine learning algorithm so don’t expect anything fancy. I compare two supervised machine learning classification models. One is K Nearest Neighbor and the other is Logistic Regression. I don’t have an answer, why I decided to use those two. With practice comes more experience so I will apply other models later.
Before using any of these models, I split my data into X_train, X_test, y_train, y_test with the train_test_split function. I decided to set 20% of the data for testing my model.
KNeighborsClassifier
Although k Nearest Neibor method has several parameters to set up, I will decide on k. There is a cool GridSearchCV method for that, but first of all, I want to explore how different k values affect accuracy for training and testing data.
I will use the code below for that:
 from sklearn.neighbors import KNeighborsClassifier

  neighbors = np.arange(1, 10)
  train_accuracy = np.empty(len(neighbors))
  test_accuracy = np.empty(len(neighbors))
  for i, k in enumerate(neighbors):
      knn = KNeighborsClassifier(n_neighbors=k)
      knn.fit(X_train, y_train)
      train_accuracy[i] = knn.score(X_train, y_train)
      test_accuracy[i] = knn.score(X_test, y_test)
The image shows how different k values in the interval [1:9] affect accuracy. My goal is to use k value that gives the least difference between training and testing accuracy so that it won’t create overfitting or underfitting.
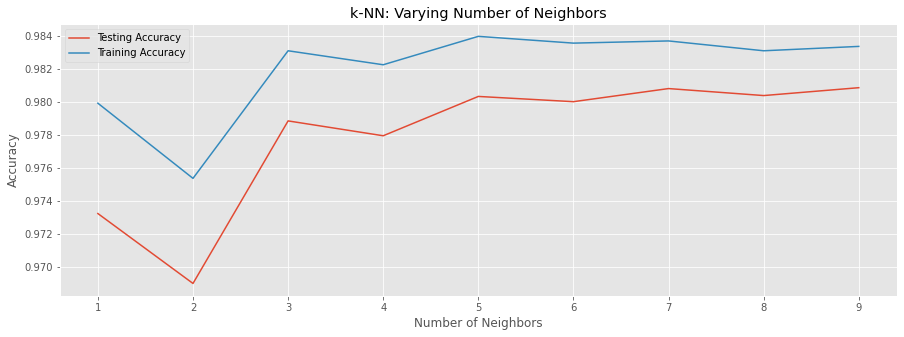
From the plot, it is clear that k=9 gives the best performance. Nevertheless, I use GridSearchCV to find the best parameter for the K-NN model. The advantage of this method is that it trains data using cross-validation. I use 5 folds.
from sklearn.model_selection import GridSearchCV
param_grid = {'n_neighbors': np.arange(1, 10)}
knn = KNeighborsClassifier()
knn_cv = GridSearchCV(knn, param_grid, cv=5)
knn_cv.fit(X_train, y_train)
y_pred = knn_cv.predict(X_test)

print(knn_cv.best_params_)
print(knn_cv.best_score_)
My model accuracy is 0.98048 with k = 9. It seems great for the first time. However, in a previous post, I wrote that the mortality rate from Covid19 is 2%. So if my model would label everything as recovered, then accuracy would be 0.98 as well. So this is not the best way to evaluate the model. At the moment my choice is to use the confusion matrix as the real performance evaluator.
from sklearn.metrics import classification_report
from sklearn.metrics import confusion_matrix

print(confusion_matrix(y_test, y_pred))
print(classification_report(y_test, y_pred))
The result is not so good.
[[  150   260]
 [  102 18382]]

              precision    recall  f1-score   support

           0       0.60      0.37      0.45       410
           1       0.99      0.99      0.99     18484

    accuracy                           0.98     18894
The idea of this model is to predict who will need more attention during the sickness. My model predicts that 260 people that died will recover. This is Error Type I. In this case, it is more important than Type II (102 people recovered, but model predicted that they would die).
LogisticRegression
I tried one more algorithm to predict the outcome - Logistic Regression.
from sklearn.model_selection import train_test_split
from sklearn.linear_model import LogisticRegression
from sklearn.model_selection import GridSearchCV

c_space = np.logspace(-5, 8, 15)
param_grid = {'C': c_space, 'penalty': ['l1', 'l2']}
logreg = LogisticRegression(solver = 'saga', max_iter=400)
logreg_cv = GridSearchCV(logreg, param_grid, cv=5)
logreg_cv.fit(X_train, y_train)
y_pred = logreg_cv.predict(X_test)

print("Tuned Logistic Regression Parameter: {}".format(logreg_cv.best_params_))
print("Tuned Logistic Regression Accuracy: {}".format(logreg_cv.best_score_))
print(confusion_matrix(y_test, y_pred))
print(classification_report(y_test, y_pred))
I use GridSearchCV to tune two parameters of the model. Its C parameter and penalty. Parameter C = 1/λ, where λ controls model complexity. If λ is very low or 0, the model can overfit data by assigning big values to the weights for each parameter. If we increase the value of λ too much, the model will tend to underfit, as the model will become too simple. A regression model that uses the L1 regularization technique is called Lasso Regression and the model which uses L2 is called Ridge Regression. After applying GridSearchCV the best parameters are:
Tuned Logistic Regression Parameter: {'C': 0.05179474679231213, 'penalty': 'l1'}
Tuned Logistic Regression Accuracy: 0.9808669381964172
With those parameters, the model gets a bit better than in the KNN case, but still, there is room for improvement.
[[  153   257]
 [  101 18383]]
              precision    recall  f1-score   support

           0       0.60      0.37      0.46       410
           1       0.99      0.99      0.99     18484
)